Hydrologic and environmental thresholds in stream fish assemblage structure across flow regimes
J. Tyler Fox and Dan D. Magoulick. Ecological Indicators, Volume 144, https://doi.org/10.1016/j.ecolind.2022.109500.
The characteristic pattern of variation in flow magnitude, frequency, duration, timing, and rate of change defines the flow regime of rivers and streams and is a key driver of ecosystem processes in fluvial ecosystems. Understanding how freshwater biotic assemblages change across gradients of hydrology and anthropogenic-source disturbance in different streamflow regimes is crucial to managing for sustainable environmental flows and watershed conservation. We compiled long-term (1916–2016) occurrence records for fishes collected in the Ouachita-Ozark Interior Highlands and West Gulf Coastal Plain streams, together with hydrologic metrics calculated from daily streamflow data measured at USGS stream gauging stations (n = 111), to examine important drivers and thresholds for fish assemblage turnover in groundwater (GW), runoff (RO), and intermittent (INT) flow regimes. We also examined the importance of spatial gradients (latitude, longitude, elevation, drainage area) and anthropogenic-source stressors (Hydrologic Disturbance Index; HDI) for fish assemblage turnover using a gradient forest modeling approach. Watershed fragmentation was of high importance for fish assemblage turnover in RO and INT streams, while changes in dam storage were more important for fishes in GW streams. Hydrologic metrics describing seasonal and stochastic properties of daily streamflow (Mag6) were most important for fish assemblage turnover in INT streams. Timing of high flow events had significantly higher importance compared to flow magnitude, duration, and frequency metrics, especially for fish assemblages in GW and INT streams. The frequency and timing of low flow events had high importance for fish assemblage turnover across all stream flow classes, while the magnitude of low flows and the magnitude and rate of change of average flows was most important for INT stream fish assemblages. In addition to benefiting multi-species conservation and management actions through identification of local and regional flow-ecology relationships generalized across different flow regimes, the results of this study provide a better understanding of complex nonlinear threshold effects, which is critical to anticipating changes in aquatic ecosystems and communities.
The characteristic pattern of variation in flow magnitude, frequency, duration, timing, and rate of change defines the flow regime of rivers and streams and is a key driver of ecosystem processes in fluvial ecosystems. Understanding how freshwater biotic assemblages change across gradients of hydrology and anthropogenic-source disturbance in different streamflow regimes is crucial to managing for sustainable environmental flows and watershed conservation. We compiled long-term (1916–2016) occurrence records for fishes collected in the Ouachita-Ozark Interior Highlands and West Gulf Coastal Plain streams, together with hydrologic metrics calculated from daily streamflow data measured at USGS stream gauging stations (n = 111), to examine important drivers and thresholds for fish assemblage turnover in groundwater (GW), runoff (RO), and intermittent (INT) flow regimes. We also examined the importance of spatial gradients (latitude, longitude, elevation, drainage area) and anthropogenic-source stressors (Hydrologic Disturbance Index; HDI) for fish assemblage turnover using a gradient forest modeling approach. Watershed fragmentation was of high importance for fish assemblage turnover in RO and INT streams, while changes in dam storage were more important for fishes in GW streams. Hydrologic metrics describing seasonal and stochastic properties of daily streamflow (Mag6) were most important for fish assemblage turnover in INT streams. Timing of high flow events had significantly higher importance compared to flow magnitude, duration, and frequency metrics, especially for fish assemblages in GW and INT streams. The frequency and timing of low flow events had high importance for fish assemblage turnover across all stream flow classes, while the magnitude of low flows and the magnitude and rate of change of average flows was most important for INT stream fish assemblages. In addition to benefiting multi-species conservation and management actions through identification of local and regional flow-ecology relationships generalized across different flow regimes, the results of this study provide a better understanding of complex nonlinear threshold effects, which is critical to anticipating changes in aquatic ecosystems and communities.
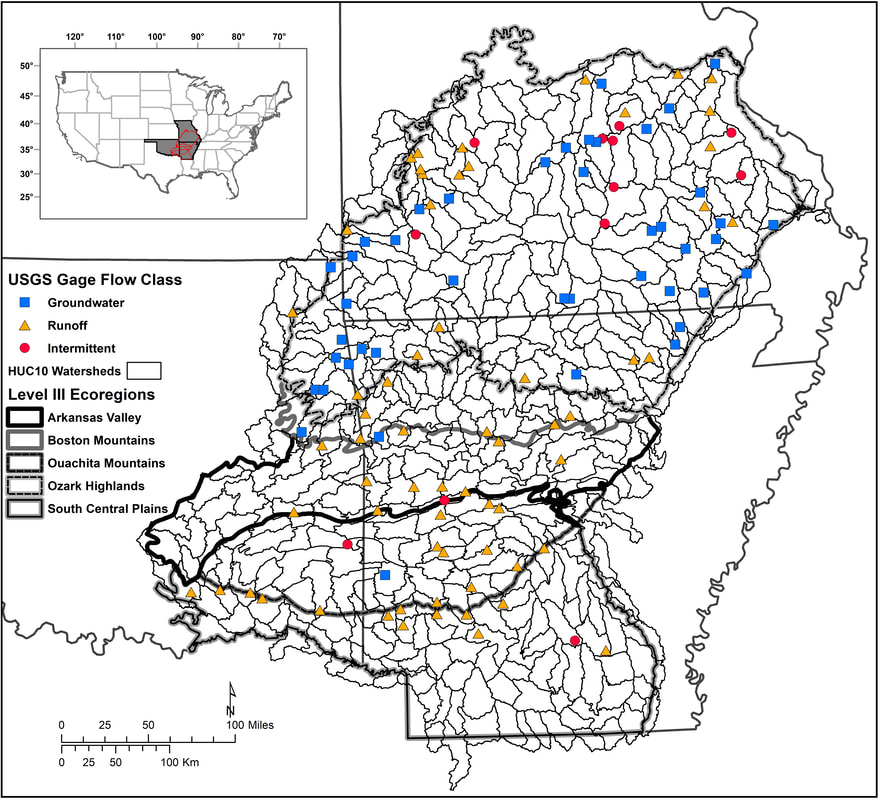
Map of the study area showing the locations and flow classes of USGS stream gages, along with level 10 hydrologic units (HUC10) and level III ecoregions.
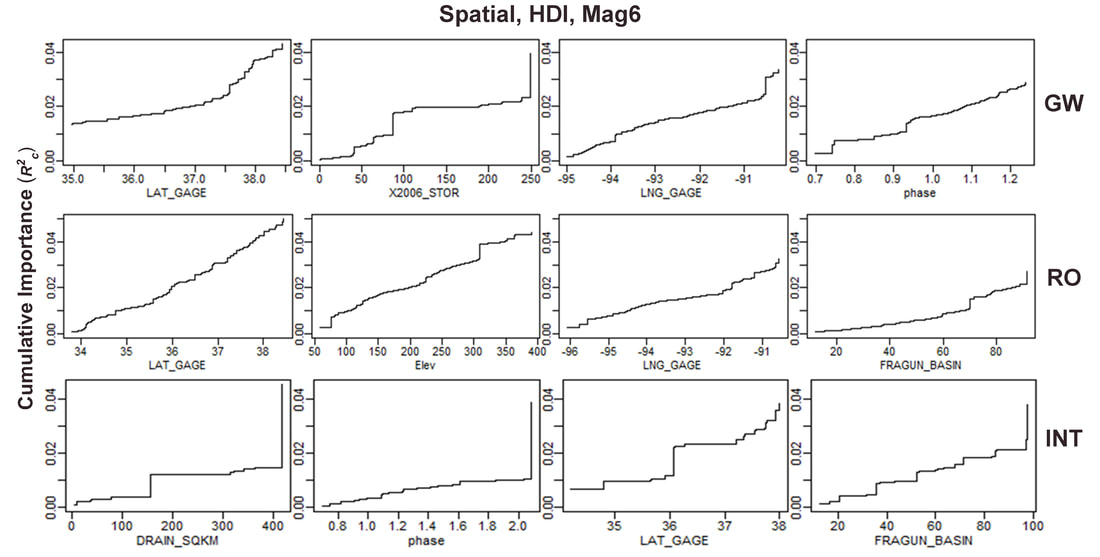
Gradient forest cumulative importance curves for spatial, Hydrologic Disturbance Index (HDI), and Mag6 variables constructed using the split information contained in the individual species models and indicating relative patterns of compositional change of fish assemblages in groundwater (GW), Runoff (RO), and Intermittent (INT) streams. Plots for each predictor show cumulative R2c weighted importance distributions standardized by density of observations, averaged over all species. Steeper slopes or steps of the response curves indicate values along the gradient of each predictor where variables gain higher importance in assemblage turnover. For example, upstream drainage area (km2) was most important for fish assemblage turnover in INT streams, with an apparent threshold at around 150 km2 indicating a pronounced transition between fish assemblages across intermittent stream sites.
|
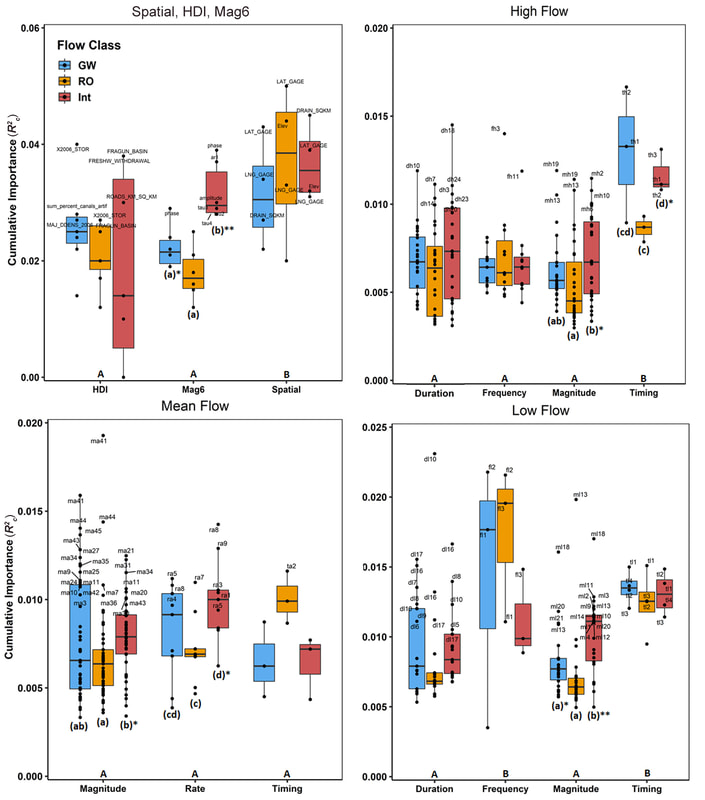
Box plots summarizing the distributions in gradient forest model cumulative importance values for variables and metric categories for groundwater (GW), runoff (RO) and intermittent (INT) flow regimes. The y-axis labels differ among the plots and points are labeled for metrics with cumulative importance values ≥ 0.025 (Hydrologic Disturbance Index; HDI and Mag6) and ≥ 0.1 (High, Mean, Low flow). Lowercase letters in parentheses show statistical relationships between stream flow classes. Uppercase letters along the x-axis compare the equality of the distributions of cumulative importance values among the different metric categories. Shared letters indicate no significant difference (α > 0.5) and only categories and flow classes with significant differences are labeled. Significance of variable coefficients: p ≤ 0.001***, p ≤ 0.01**, p ≤ 0.05*. See Appendix S1: Tables S1-S4 for a full summary of the statistical comparisons. Box plots depict the minimum, first quartile, median, third quartile, and maximum, with outliers depicted as single points.
|
Predicting hydrologic disturbance of streams using species occurrence data.
J. Tyler Fox and Dan D. Magoulick. Science of The Total Environment, 686, 2019, 254-263, https://doi.org/10.1016/j.scitotenv.2019.05.156
Aquatic organisms have adapted over evolutionary time-scales to hydrologic variability represented by the natural flow regime of rivers and streams in their unimpaired state. Rapid landscape change coupled with growing human demand for water have altered natural flow regimes of many rivers and streams on a global scale. Climate non-stationarity is expected to further intensify hydrologic variability, placing increased pressure on aquatic communities. Using a machine learning approach and georeferenced species occurrence data, we modeled and mapped spatial patterns of hydrologic disturbance for streams in Arkansas, Missouri, and eastern Oklahoma. Random forest (RF) models trained on fish community data, hydrologic, and landscape metrics for gaged streams in the National Hydrography (NHDPlusV2) database were used to predict a hydrologic disturbance index (HDI) for ungaged streams. The HDI is part of the USGS Geospatial Attributes of Gages for Evaluating Streamflow (GAGESII) database and is a composite index of watershed-scale disturbance from anthropogenic stressors. Fish presence/absence data had similar overall model prediction accuracy (77%; 95% CI: 0.74, 0.80) as flow variables (76%; CI: 0.73, 0.80). Including topographic variables increased the RF prediction accuracy of both the fish (90%; CI: 0.88, 0.92) and flow models (86%; CI: 0.84, 0.89). Spatial patterns of hydrologic disturbance suggest distinct ecohydrological regions exist where conservation actions may be focused. Streams with low HDI were predominately located in the Ozark Highlands, Boston Mountains, and Ouachita Mountains. Correlation analysis of HDI by flow regime showed groundwater stable streams had the lowest disturbance frequency, with over 50% of stream reaches with low HDI located in forested land cover. HDI was highest for big rivers, intermittent runoff streams and streams in areas of agricultural land use. Our results show long-term georeferenced biological data can provide a valuable resource for predictive modeling of hydrologic disturbance for ungaged rivers and streams.
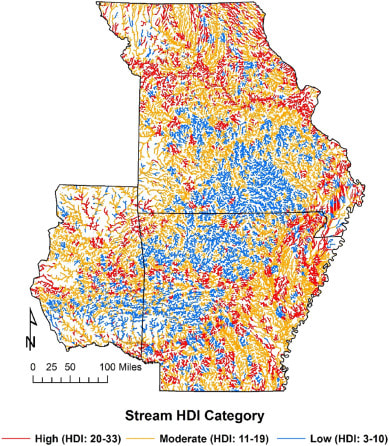
Map of the regional stream network classified by HDI category. HDI values were assigned to stream reaches based on their proximity to a classified location (gaged and ungaged) within the linear stream network.
|
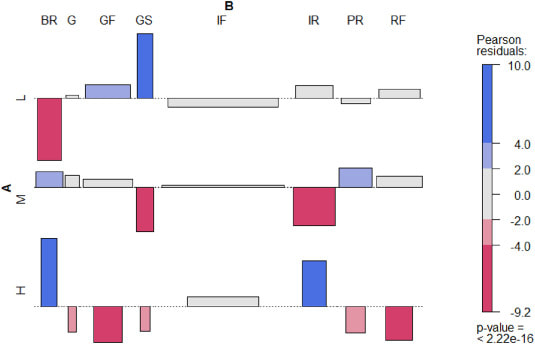
Correspondence analysis contribution bi-plot of HDI by natural flow regime categories: big rivers (BR), groundwater (G), groundwater flashy (GF), groundwater stable (GS), intermittent flashy (IF), intermittent runoff (IR), perennial runoff (PR), and runoff flash (RF). GS streams were more likely to have low HDI, while BR and IR flow regimes had the highest frequency of streams with high HDI.
|
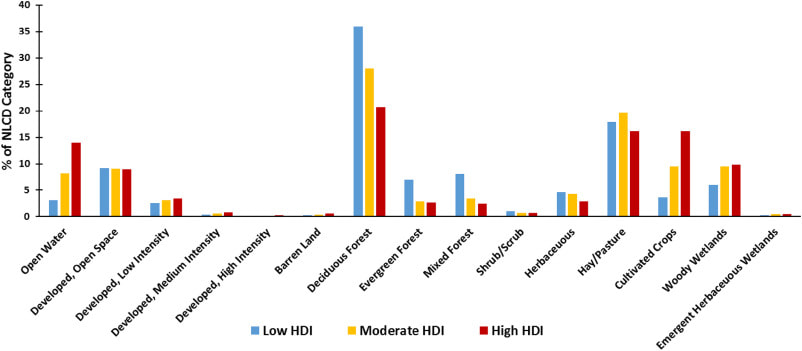
Distribution of 2011 NLCD land use by HDI category for gaged and ungaged streams (n = 8218).
The Changing Face of Water: A Dynamic Reflection of Antibiotic Resistance Across Landscapes.
Claire E. Sanderson, J. Tyler Fox, Eric R. Dougherty, Andrew D. S. Cameron,and Kathleen A. Alexander (Front. Microbiol., 2018, https://doi.org/10.3389/fmicb.2018.01894)
Little is known about the role of surface water in the propagation of antibiotic resistance (AR), or the relationship between AR and water quality declines. While healthcare and agricultural sectors are considered the main contributors to AR dissemination, few studies have been conducted in their absence. Using linear models and Bayesian kriging, we evaluate AR among Escherichia coli water isolates collected bimonthly from the Chobe River in Northern Botswana (n = 1997, n = 414 water samples; July 2011–May 2012) in relation to water quality dynamics (E. coli, fecal coliform, and total suspended solids), land use, season, and AR in wildlife and humans within this system. No commercial agricultural or large medical facilities exist within this region. Here, we identify widespread AR in surface water, with land use and season significant predicators of AR levels. Mean AR was significantly higher in the wet season than the dry season (p = 0.003), and highest in the urban landscape (2.15, SD = 0.098) than the protected landscape (1.39, SD = 0.051). In-water E. coli concentrations were significantly positively associated with mean AR in the wet season (p < 0.001) but not in the dry season (p = 0.110), with TSS negatively associated with mean AR across seasons (p = 0.016 and p = 0.029), identifying temporal and spatial relationships between water quality variables and AR. Importantly, when human, water, and wildlife isolates were examined, similar AR profiles were identified (p < 0.001). Our results suggest that direct human inputs are sufficient for extensive dispersal of AR into the environment, with landscape features, season, and water quality variables influencing AR dynamics. Focused and expensive efforts to minimize pollution from agricultural sources, while important, may only provide incremental benefits to the management of AR across complex landscapes. Controlling direct human AR inputs into the environment remains a critical and pressing challenge.
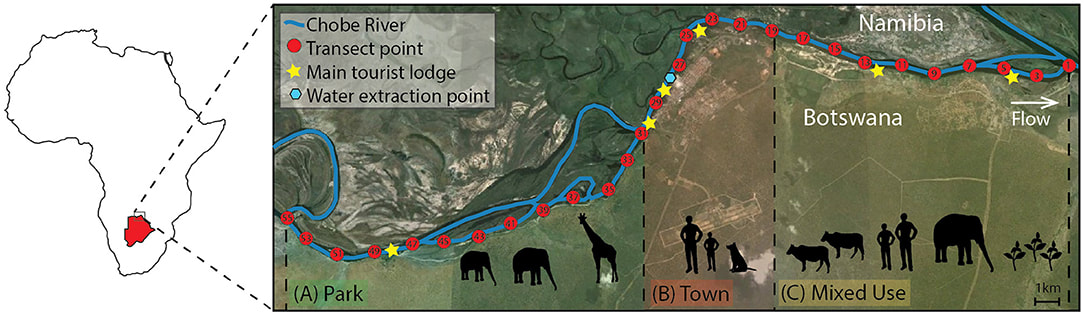
The study site is located in Northern Botswana (red map inset) in sub-Saharan Africa, and spans three different land use types (Town, Mixed Use, and Park, shown in red, yellow, and green, respectively). Transect points for water sample collection are noted in red and are located at 1 km intervals along the Chobe River. Tourist lodges (stars) and the water intake point in Town (blue hexagon) are noted.
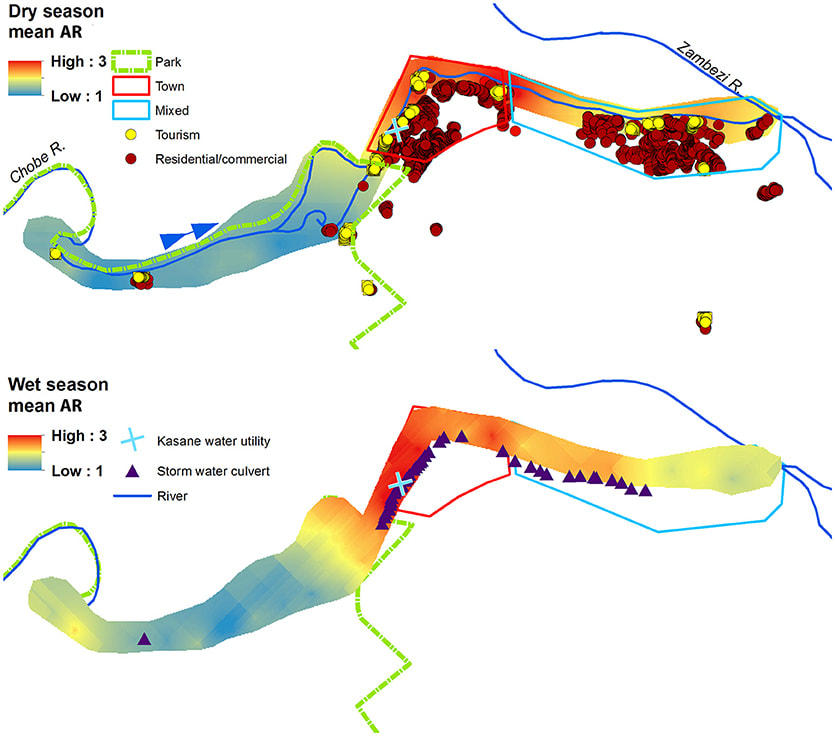
Prediction surfaces of mean wet and dry season antibiotic resistance (AR) interpolated using empirical Bayesian kriging (EBK). Park (green border), Town (red border), and Mixed (light blue border) land use boundaries are shown, along with commercial, residential, and tourism buildings, and storm water culverts. The blue arrow indicates the direction of Chobe River flow.
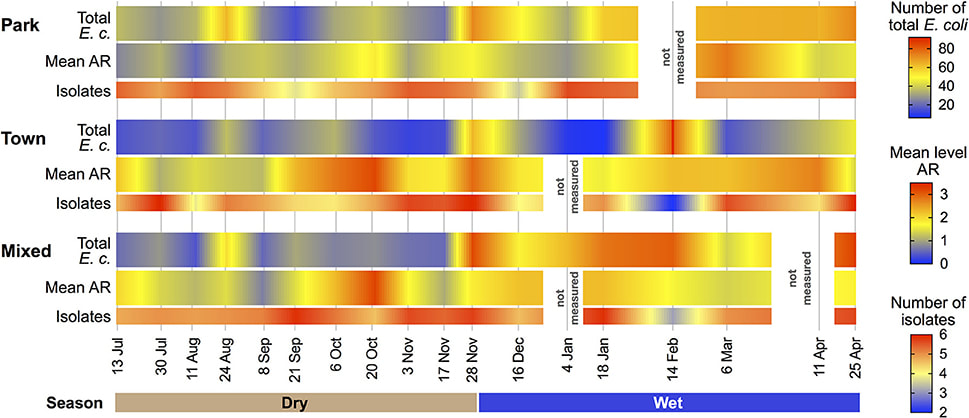
Mean water Escherichia coli isolates exhibiting antibiotic resistance (AR), corresponding total E. coli counts and number of E. coli isolates obtained during water quality assessments within each land use type and sampling period.
Multi-decadal remote-sensing analysis of land cover change in the dryland savanna of northern Botswana.
J. Tyler Fox and Kathleen A. Alexander (Land, 2017, https://doi.org/10.3390/land6040073)
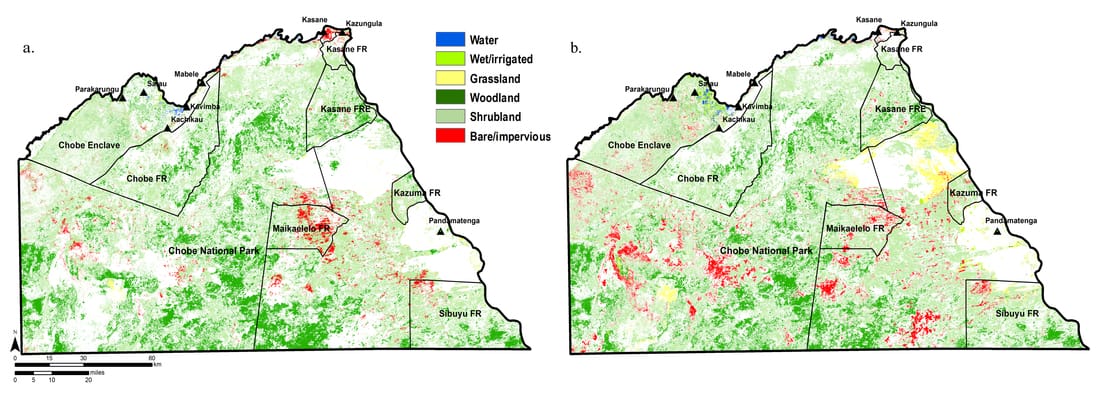
Water scarcity and highly variable rainfall regimes make dryland savannas particularly vulnerable to landscape degradation, yet understanding of complex environmental couplings and feedbacks driving long-term patterns of land cover change (LCC) in these systems is lacking. We classified and assessed net and gross (class) LCC for the Chobe District in northern Botswana (21,000 km2) using Landsat TM, ETM+, and OLI satellite imagery from 1990, 2003, and 2013. We further assessed rates and direction of LCC across land uses and management regimes using a matrix-based, intensity analysis approach. We interpreted observed LCC in the context of recent fire history using Moderate Resolution Imaging Spectroradiometer (MODIS) monthly active fire data (MCD14ML), rainfall, and estimates of elephants biomass (Large Stock Units/km2) derived from dry season wildlife aerial surveys. An estimated 10,892 km2 (52%) of Chobe District land area experienced quantifiable LCC from 1990-2013, with marginally higher annual rate of change from 2003-2013. Net loss of woodland over the study period (1,514 km2, 16.2% of initial class total) was accompanied by net expansion of shrubland (1,305 km2, 15.7%) and grassland (265 km2, 20.3%). Average net woodland losses were higher in protected forest reserves (33%) and settlement buffers (32%). Intensity analysis and gross LCC showed woodland did not follow a simple linear process of unidirectional decline, but instead underwent extensive bi-directional exchange with shrubland. While over-browsing by elephant has been frequently cited as the major cause of woodland degradation in northern Botswana, we found the majority of land cover associated with elephant biomass >20 LSU/km2 experienced no detectible change from 2003-2013. Couplings between rainfall and fire evident at the observed spatiotemporal scale suggest short-term climate oscillations strongly influence the structure of savanna woodlands over decadal time-periods. Understanding long-term patterns of change in semi-arid savanna systems requires consideration of the size and intensity of gross changes in relation to system resilience to disturbance, including where tipping points may occur given future climate change scenarios.
Maps of (a.) woodland and (b.) shrubland change from 1990-2013. Exchange between woodland and shrubland represented the major proportion of change among the two classes. White areas show land cover not involved woodland and shrubland change.
Spatiotemporal Variation and the Role of Wildlife in Seasonal Water Quality Declines in the Chobe River, Botswana
Fox, J.T. and K.A. Alexander 2015, PlosOne, https://doi.org/10.1371/journal.pone.0139936
Sustainable management of dryland river systems is often complicated by extreme variability of precipitation in time and space, especially across large catchment areas. Because of the extensive provision of ecosystem services and high subsistence value of southern African dryland rivers and wetland systems, there is a critical need to better understand the interdependent drivers of regional water quality changes. Using field transect data, GIS and remote sensing analysis, and spatiotemporal modeling, we examined seasonal variation of the fecal indicator bacteria, Escherichia coli (E. coli), and total suspended solids (TSS) in the Chobe River in relation to land use and hydrology. Our results suggest that direct deposition of fecal material in the Chobe River by wildlife, as well as accumulation feces in the landscape and subsequent flushing by rainfall and seasonal floods, are significant drivers of water quality declines in this dryland system. Protected land use (p = 0.0009) and the presence of river floodplain (p = 0.016) were both significantly associated with higher E. coli concentrations. In-river concentrations of E. coli were greatest in areas where wildlife biomass was highest. While the impact of agricultural land use on water quality is well recognized, loss of habitat and limited water access for wildlife in water restricted regions might increase the impact of natural species on surface water resources. In these dryland environments, management of the land-water interface will be increasingly challenged by the need to integrate uses across multiple competing sectors in order to sustainability manage these vulnerable systems.
|
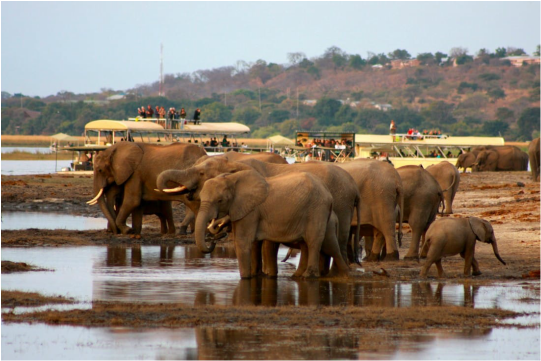
High densities of wildlife species in and along the river during the dry season represents a unique and lucrative ecotourism opportunity. However, increased tourism activity may exacerbate seasonal water quality declines in the Chobe system.
|
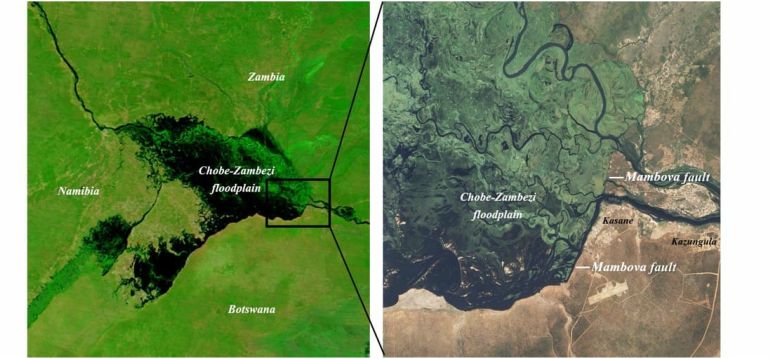
MODIS Terra (left) and Advanced Land Imager, EO-1 images acquired May 8, 2010 showing the geological and hydrological influence of the Mambova fault.
|
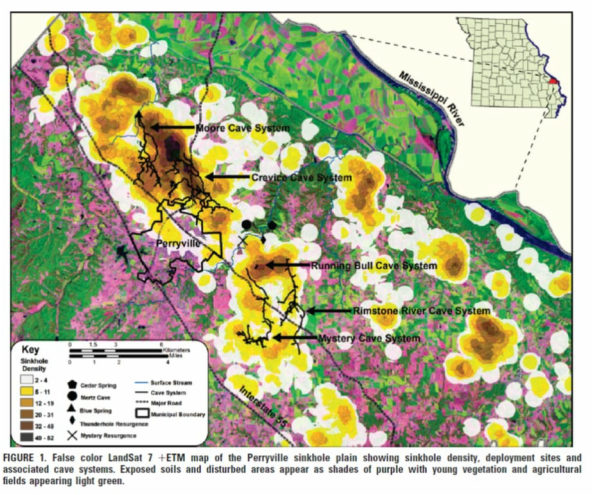
Passive Sampling of Bioavailable Organic Chemicals in Perry County, Missouri Cave Streams
J. Tyler Fox, Ginny Adams*, Martin Sharum, and Karen L. Steelman. 2010. Env. Sci. Technol., https://doi.org/10.1021/es1019367
Two types of passive samplers – semipermeable membrane devices (SPMDs) and polar organic chemical integrative samplers (POCIS) – were deployed in spring 2008 to assess bioavailable concentrations of aquatic contaminants in five cave streams and resurgences in Perry County, Missouri. Study sites represent areas of high cave biodiversity and the only known habitat for grotto sculpin (Cottus carolinae). Time-weighted average (TWA) water concentrations were calculated for 20 compounds (n = 9 SPMDs; n = 11 POCIS) originating primarily from agricultural sources, including two organochlorine insecticides, dieldrin and heptachlor epoxide, which were found at levels exceeding U.S. EPA criteria for the protection of aquatic life. GIS data were used to quantify and map sinkhole distribution and density within the study area. Infiltration of storm runoff and its influence on contaminant transport were also evaluated using land cover and hydrological data. This study provides evidence of cave stream contamination by a mix of organic chemicals and demonstrates the applicability of passive samplers for monitoring water quality in dynamic karst environments where rapid transmission of storm runoff makes instantaneous water sampling difficult.
|
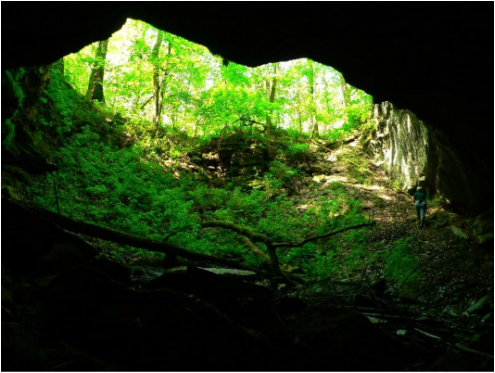
The view from Mertz Cave in Perry County, Missouri
|
|
